Methods for graph creation from point clouds
In my Graph-Creation-from-point-clouds repository I have included four function files which create graphs according to different rules. Each function takes a set of points (nodes) in a space of arbitrary dimensionality, and decides whether each pair of nodes is connected. The functions output the network in the form of an edgelist: each row is one edge [node i, node j, distance between].
See Compare_graph_creation_functions.m for a script to create the figures below.
K nearest-neighbors Graph
Create_KNN_graph.m
Connect each node to its k nearest neighbors. [node i, node j, distance] is included in edgelist if j is a nearest neighbor of i (the reverse may or may not be true). This type of graph creation rule produces directed edges due to the asymmetry of KNN.
 Using K=3
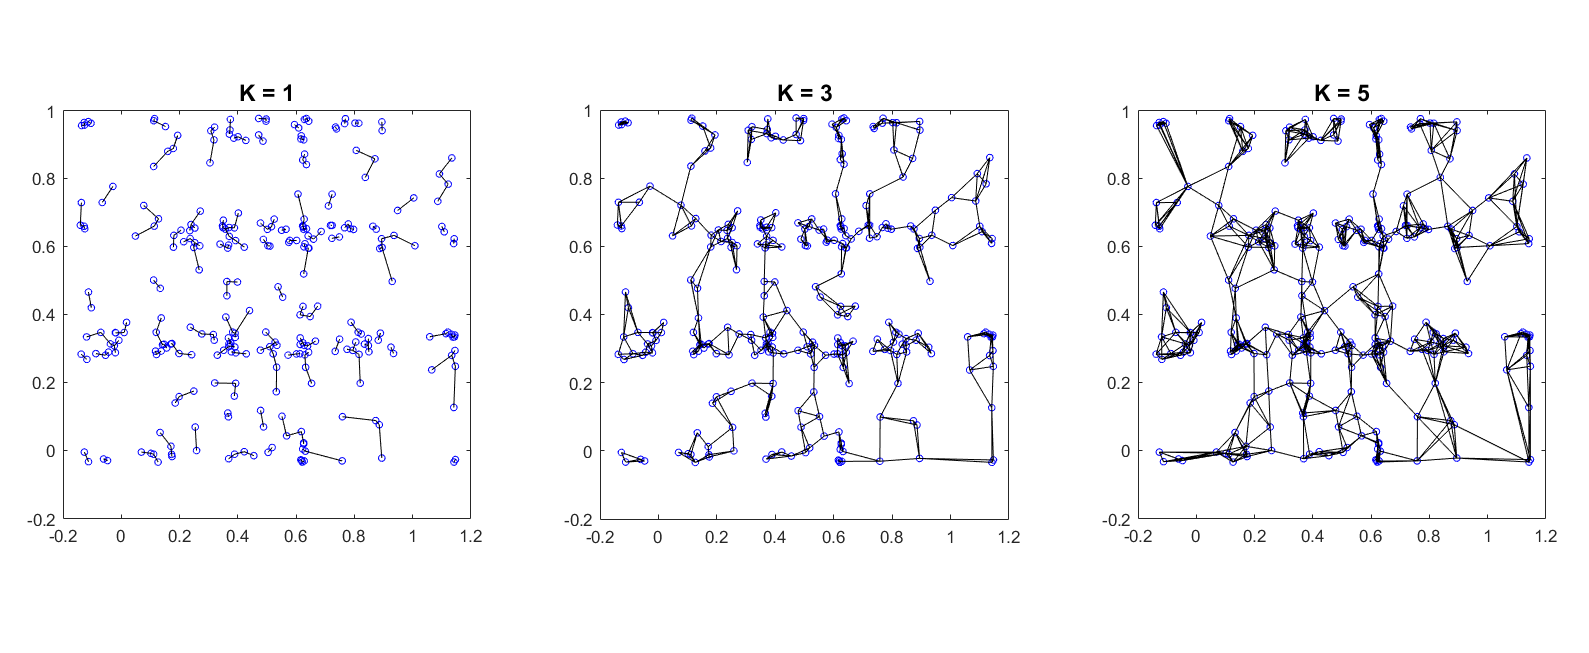 Varying K
Epsilon ball Graph
Create_epsilonball_graph.m
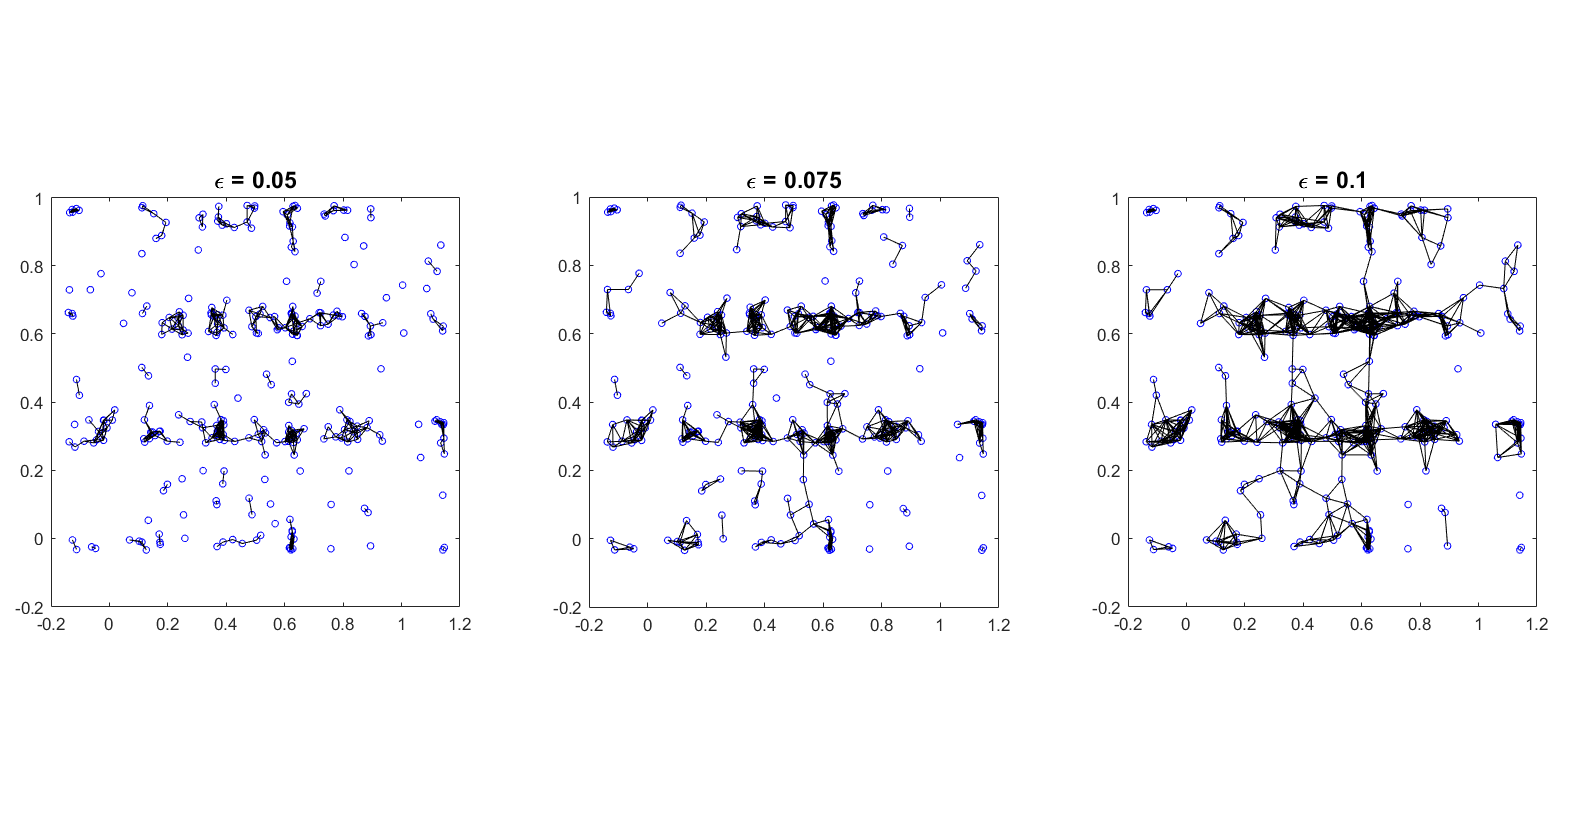
Connect each node to all others within a distance \(\epsilon\). This graph will be undirected.
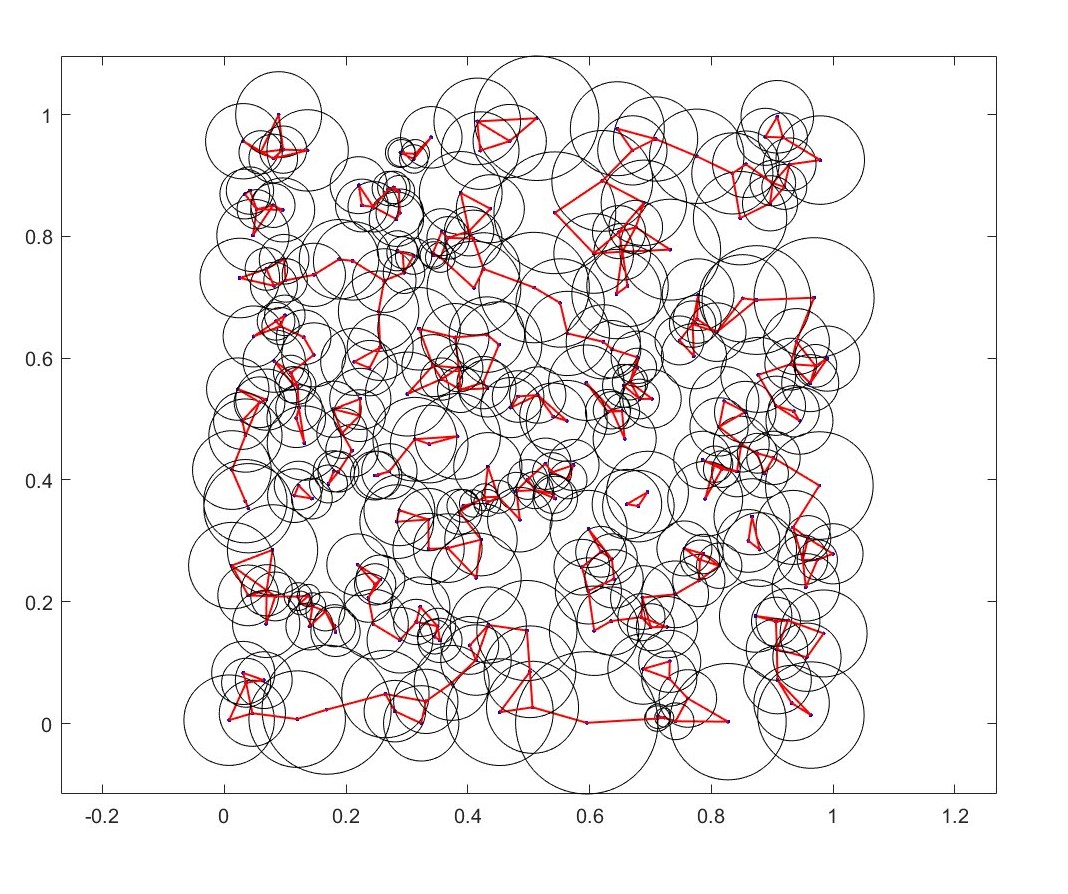
Fixed \(\epsilon\)
Dynamic \(\epsilon\)
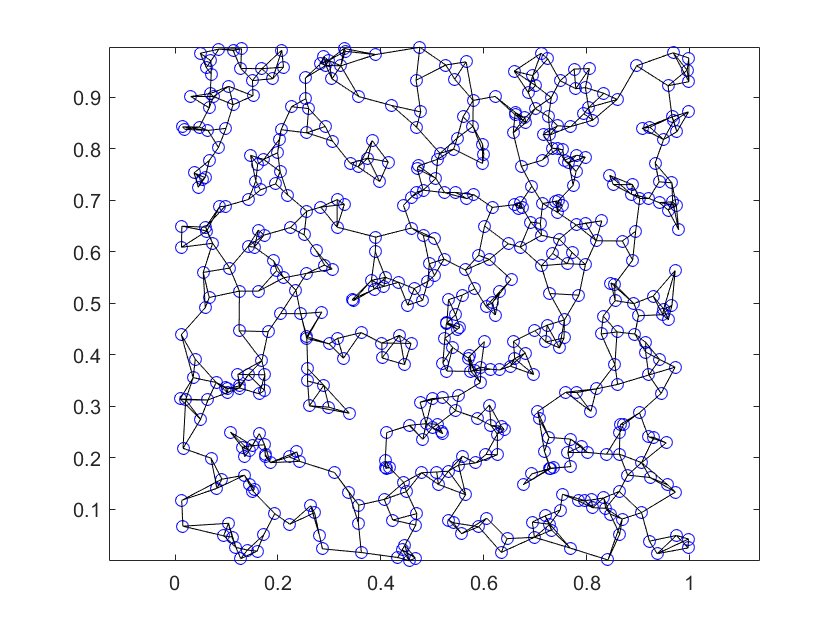
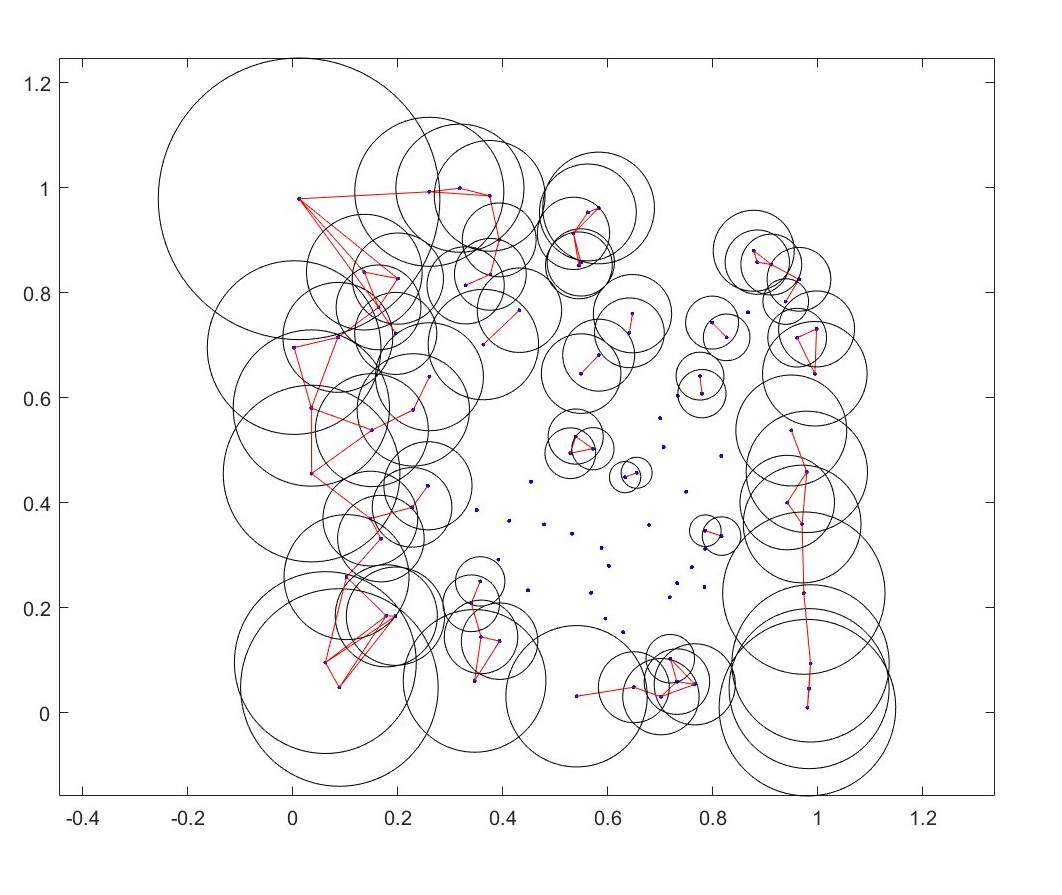 You can also make the epsilon radius epsilon radius a function of the data itself. Above I’ve made \(\epsilon\) inversely proportional to a metric of the local density of points. Each point now uses its own \(\epsilon\) circles). Local density was measured similarly to using a radial basis kernel (gaussian if youre in physics; normal distribution if youre in statistics..) but instead uses a purely exponentially decaying weight.
 Here \(\epsilon\) radius is proportional to the mean of the distance to second and third nearest neighbors.
Tau Rule Graph
Create_Tau_Rule_graph.m
This graph decides whether each pair of nodes are connected according to the tau rule. As of now I cant find the source where I learned about this.
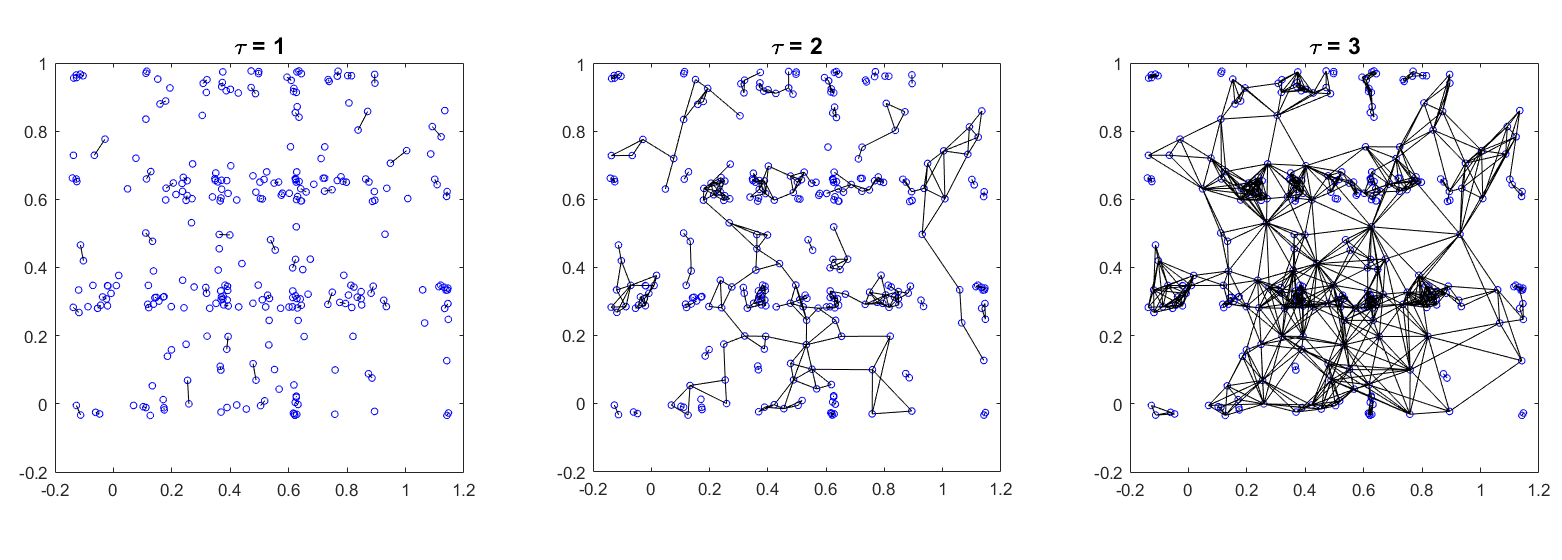 The same data set using different \(\tau =2.2\) values.
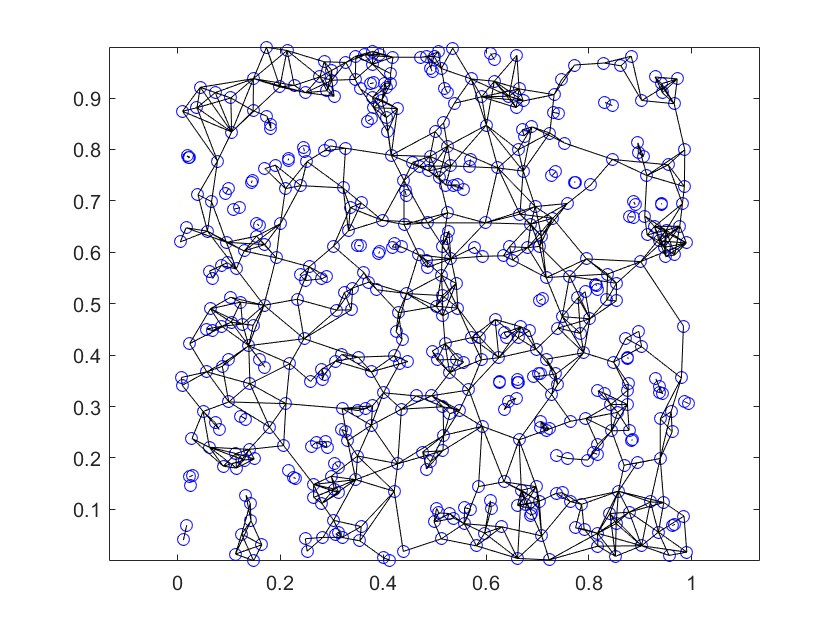 \(\tau =2.2\) with 500 points.
function [edglst]=Create_Tau_Rule_graph(dat,tau)
% builds graph from data using tau rule
%INPUT: dat=data matrix [n x d] : n points in R^d
%tau = positive number >= 1

%OUTPUT: UNDIRECTED edge list [#edges x 3].  d is the distance
%(used as edge weight) along that edge
K=1;%do not alter!
[N, dist]=knnsearch(dat,dat,'K',K+1,'NSMethod','kdtree','Distance','Euclidean');%NOTE: nearest neighbor sets are not necessarily symmetric
N=N(:,2:end); %index of each point's nearest neighbor. first col is each point itself
dist=dist(:,2:end); %distance to each point's nearest neighbor
edglst=[];
M=size(dat,1);

for u=2:M
    for v=1:u-1
        if (dist(u)<=tau*dist(v))&&(dist(v)<=tau*dist(u))
            if (norm(dat(u,:)-dat(v,:))<=tau*dist(u))||(norm(dat(u,:)-dat(v,:))<=tau*dist(v))
               edglst=[edglst; u, v, norm(dat(u,:)-dat(v,:))];
            end
        end
    end
end

end
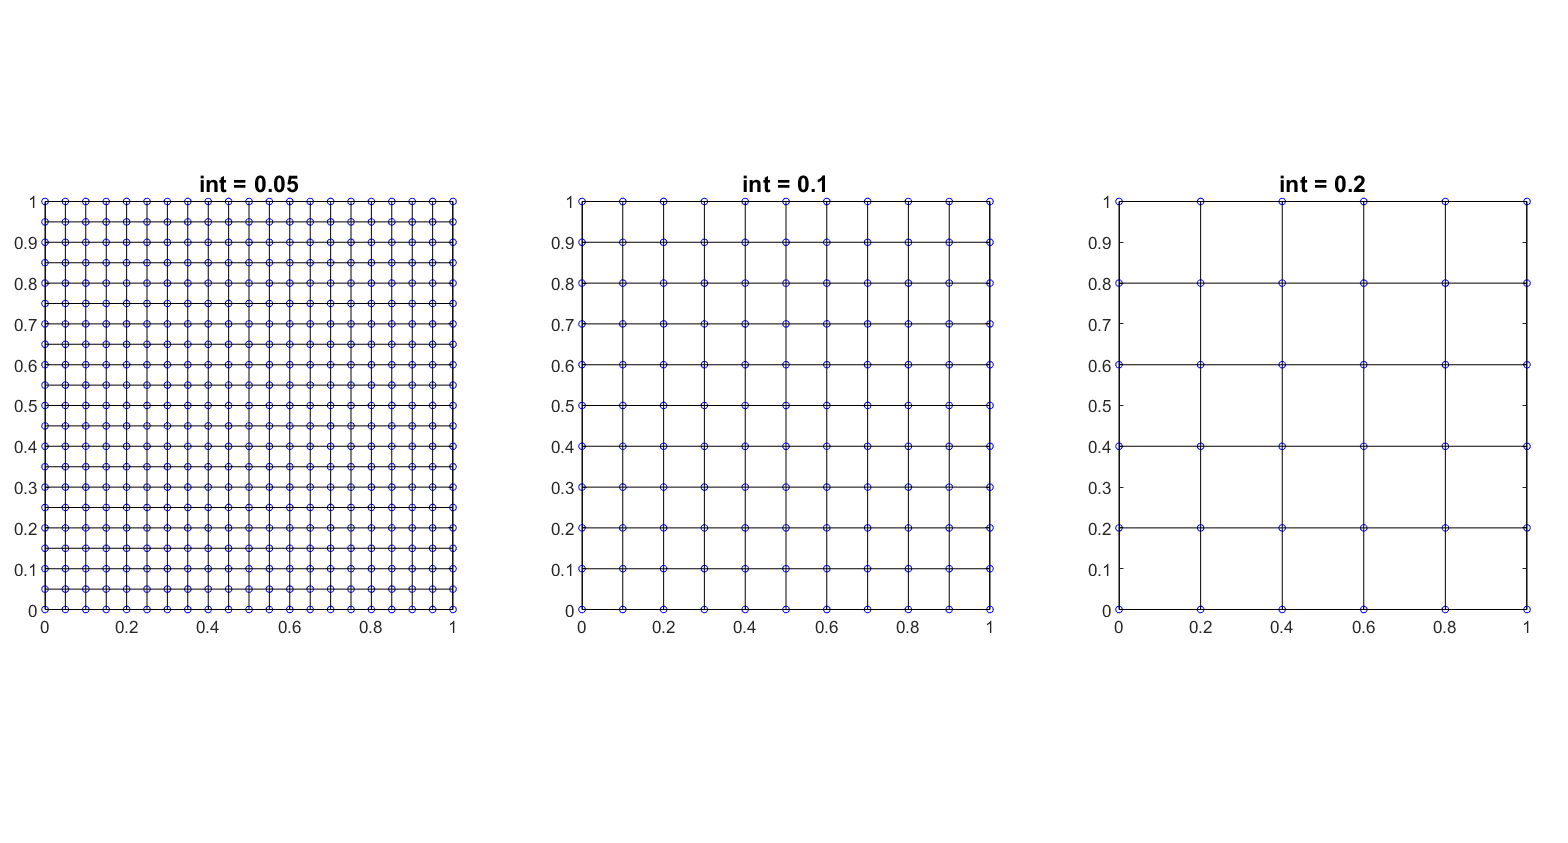
Create 2D rectangular lattice graph
The function Create_Lattice_Network_2D.m allows you to obtain the set of edges connecting points in a rectangular lattice.